We started out with this dataset since we were interested in knowing what factors contribute to traffic accidents in New York. For our main thesis, we want to focus on getting a better understanding on why and where the highest number of collisions occur and if we can identify the specific reasons for those. We also run linear regressions to measure exact relationships between various independent variables and traffic collisions/injuries. Our thesis rests on the fact that there are clear, viable ways to reduce collisions in New York and we will use figures, interactives, and models to present important information to be factored in when discussing policy related to reducing traffic-related injuries.. We would also like to highlight a few recommendations towards the end of the project.
We plan to deepen our analyses around specific storylines such as how varying seasons affect collision rates, and understand how spatial mapping can aid us in identifying locations of more accidents. We predict that areas which are more dense will have a higher number of accidents. Lastly, we will want to conclude whether we observe any significant changes before and after specific bike, pedestrian and motor vehicle laws. If yes, then what kind of policies we can recommend in order to combat the issues of high collision rates.
We spent time this week brainstorming possibilities for our interactive. Here are some of our ideas: Filtering by cause of accident, showing geographically where each cause tends to cluster. For example, we may see drastically different causes on the highway vs. on a side street. Filtering by season, displaying seasonal shifts in the geographical location of traffic collisions and types of injuries. We expect that, for example, there will be specific locations where many bike accidents occur, reflecting where safety can be improved. This can also be overlaid with pavement rating to identify if the pavement rating is more critical in more seasons; we would guess that in the winter, it is even more important to keep the pavement up-to-date. Filtering by year; much of our preliminary analysis suggests that, with the exception of 2020, there is not much variation between years. So, this filter may not be used unless there is a specific change to highlight. Filtering by hour, showing how the time of day impacts the number of collisions or the severity of the accident (by exploring variables like number of pedestrians hurt or injured). Also, an interactive can be used to explore at what time of the day are there more accidents at a certain borough. Preliminary shows that accidents are most frequently recorded at midnight in New York. These insights could potentially impact where more safety measures need to be installed and at what times of the day should these measures be the most active or intense.
library(tidyverse)## -- Attaching packages --------------------------------------- tidyverse 1.3.1 --## v ggplot2 3.3.5 v purrr 0.3.4
## v tibble 3.1.4 v dplyr 1.0.7
## v tidyr 1.1.3 v stringr 1.4.0
## v readr 2.0.1 v forcats 0.5.1## -- Conflicts ------------------------------------------ tidyverse_conflicts() --
## x dplyr::filter() masks stats::filter()
## x dplyr::lag() masks stats::lag()library(tidycensus)
library(jtools)
library(readxl)
census_api_key('13c310496f24a49f43095b640707618afb77a299')## To install your API key for use in future sessions, run this function with `install = TRUE`.collision_10000 <- read_csv(here::here('dataset/NYC_Collision_10000.csv'))## Rows: 10000 Columns: 21## -- Column specification --------------------------------------------------------
## Delimiter: ","
## chr (7): MONTH, DAY, MINUTE, BOROUGH, LOCATION, CAUSE, VEHICLE
## dbl (14): YEAR, HOUR, ZIPCODE, LATITUDE, LONGITUDE, NUMBER OF PERSONS INJURE...##
## i Use `spec()` to retrieve the full column specification for this data.
## i Specify the column types or set `show_col_types = FALSE` to quiet this message.collisions_by_hour <- collision_10000 %>% group_by(HOUR) %>% mutate(collisions_by_hour = n()) %>% distinct(HOUR, collisions_by_hour)
ggplot(collisions_by_hour, aes(x = HOUR, y = collisions_by_hour)) + geom_bar(aes(xlab = c( "0", "1", "2", "3", "4", "5",
"6", "7", "8", "9", "10", "11", "12", "13", "14", "15", "16", "17", "18", "19","20", "21", "22", "23")),stat = 'identity')## Warning: Ignoring unknown aesthetics: xlab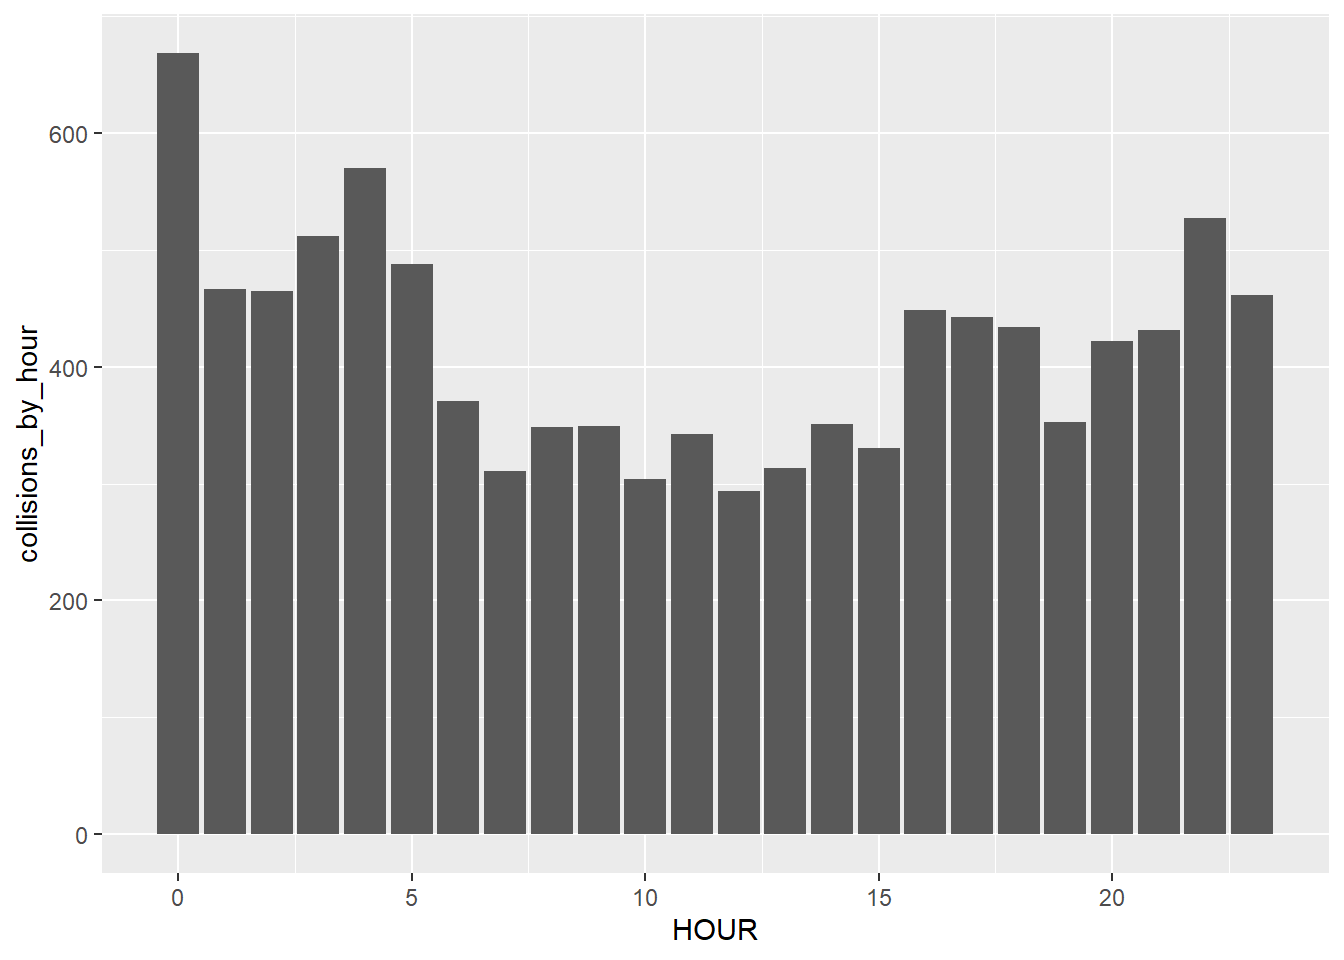 Previous analysis showed that collisions occurred in the following decreasing order: summer, fall, spring, winter. In order to delve deeper into this, we conducted some more preliminary analysis.
collision_by_day <- collision_10000 %>% group_by(YEAR, MONTH, DAY) %>% transmute(`NUMBER OF PERSONS KILLED` = sum(`NUMBER OF PERSONS KILLED`), `NUMBER OF PEDESTRIANS KILLED` = sum(`NUMBER OF PEDESTRIANS KILLED`), `NUMBER OF CYCLIST KILLED` = sum(`NUMBER OF CYCLIST KILLED`), `NUMBER OF MOTORIST KILLED` = sum(`NUMBER OF MOTORIST KILLED`), `NUMBER OF PERSONS INJURED` = sum(`NUMBER OF PERSONS INJURED`), `NUMBER OF PEDESTRIANS INJURED` = sum(`NUMBER OF PEDESTRIANS INJURED`), `NUMBER OF CYCLIST INJURED` = sum(`NUMBER OF CYCLIST INJURED`), `NUMBER OF MOTORIST INJURED` = sum(`NUMBER OF MOTORIST INJURED`))
collision_by_day <- unique(collision_by_day) %>% unite("DATE", MONTH, DAY, YEAR, sep = "/")

weather <- read_excel(here::here('dataset/WeatherData2016-2020.xlsx'))

weather <- weather %>% rename_with(toupper)
weather <- weather %>% mutate(DAY = ifelse(nchar(DAY) == 1, paste0("0", DAY), DAY))
weather <- weather %>% mutate(MONTH = ifelse(nchar(MONTH) == 1, paste0("0", MONTH), MONTH))
weather <- weather %>% unite("DATE", MONTH, DAY, YEAR, sep = "/")

merged_data <- right_join(collision_by_day, weather, by = c('DATE'))
merged_data <- merged_data %>% arrange(DATE)
merged_data <- merged_data %>% separate(DATE, c("MONTH", "DAY", "YEAR"), sep = "/")

merged_data <- merged_data %>% mutate(SEASON = case_when(MONTH %in% c("09", "10", "11") ~ "Fall", MONTH %in% c("12", "01", "02")  ~ "Winter", MONTH %in% c("03", "04", "05")  ~ "Spring", TRUE ~ "Summer"))
summ(lm(`NUMBER OF CYCLIST INJURED` ~ `SEASON`, data = merged_data))
## MODEL INFO:
## Observations: 1289 (538 missing obs. deleted)
## Dependent Variable: NUMBER OF CYCLIST INJURED
## Type: OLS linear regression
##
## MODEL FIT:
## F(3,1285) = 0.36, p = 0.78
## R² = 0.00
## Adj. R² = -0.00
##
## Standard errors: OLS
## -------------------------------------------------
## Est. S.E. t val. p
## ------------------ ------- ------ -------- ------
## (Intercept) 0.06 0.02 2.35 0.02
## SEASONSpring -0.02 0.04 -0.65 0.51
## SEASONSummer -0.00 0.03 -0.05 0.96
## SEASONWinter -0.03 0.03 -0.84 0.40
## -------------------------------------------------ggplot(merged_data) + geom_bar(aes(x = `SEASON`, y = `NUMBER OF CYCLIST INJURED`, fill = SEASON), stat = "identity") + facet_wrap(~merged_data$YEAR)## Warning: Removed 538 rows containing missing values (position_stack).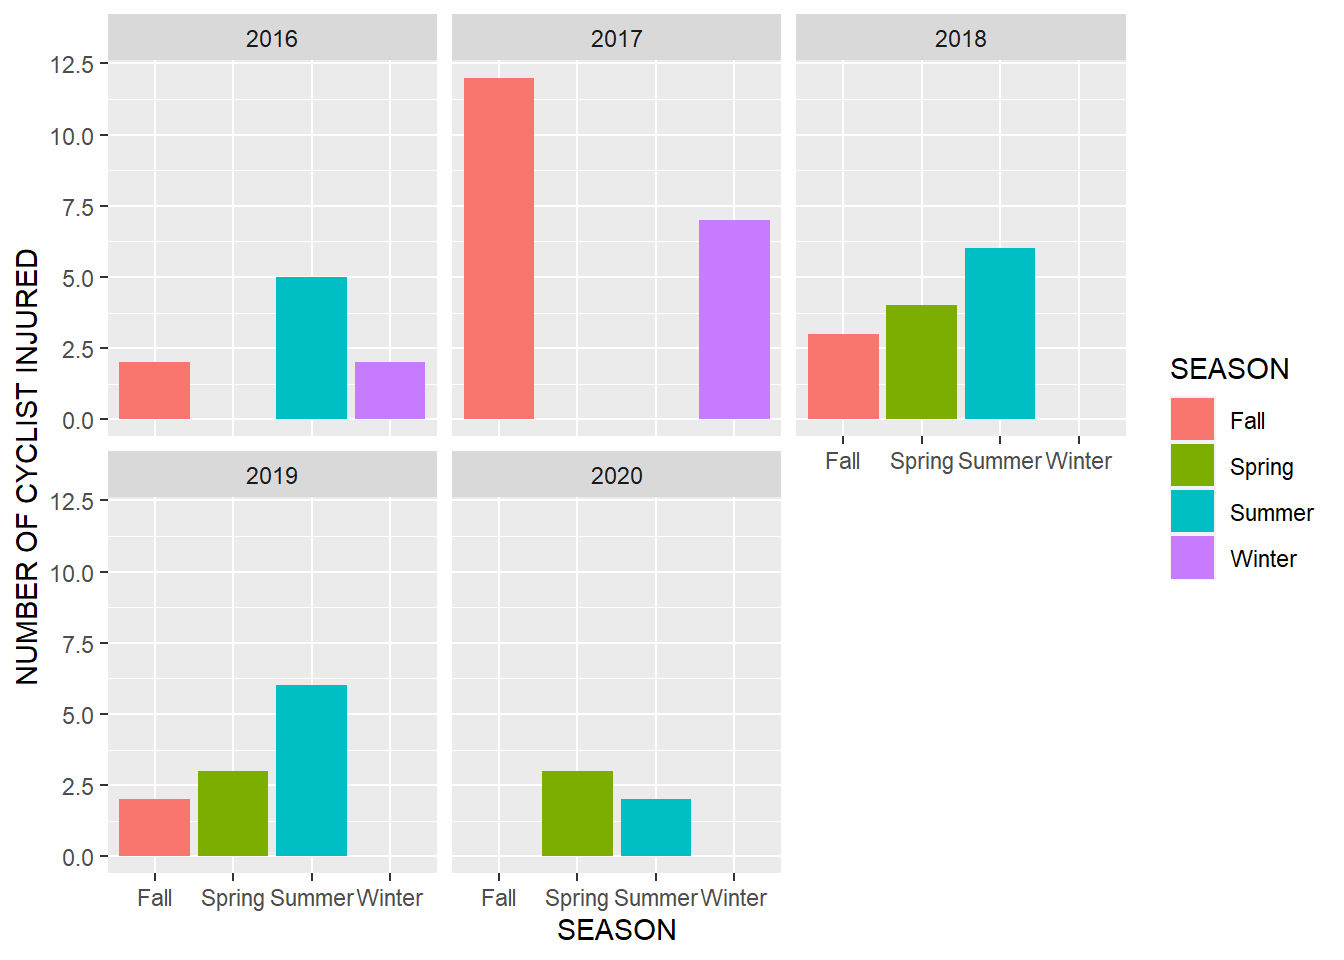 The graph produced above shows that there is a drastic difference in injured cyclists between the seasons. This difference is even more exacerbated in 2020, likely as a result of increased bicycle usage during COVID-19. An R^2 of 0.38 suggests that there is a relevant relationship between these metrics. This can be noted as one reason for the discrepancies between seasons, as more people ride bicycles in the warmer months.
In the coming week, further analysis will be conducted to discern more reasons for the differences in collisions between seasons. Here are some more preliminary ideas: It will be interesting to see where the accidents are occurring; for example, during the summer, many people commute out of the city to summer homes. A geographical analysis may show that there are more collisions on popular highways, which account for the difference, and no difference (or even fewer collisions) on the New York City streets. Calculating a death rate, dividing the number of deaths by the number of collisions, and comparing by season. There could be many reasons for discrepancies in this across seasons. One possibility is that people drive faster in the summer given more favorable weather conditions, thus making accidents deadlier. Potentially look even more granular if necessary and analyze by month.
Spatial Mapping with Pavement Rating More analysis and coding has to be done to identify any concrete correlations between road conditions and collisions due to difficulties classifying pavement rating geometry under each borough. However, pavement ratings do seem to play a noticeable role in collision frequency. Comparing the map that shows fair, good, and poor pavement roads and the map that shows proportion of collisions by zip code, there appears to be a higher proportion of accidents occuring where roads scored a pavement grade of “poor”. Though there still needs to be work done with cleaning/organizing the geometry in the pavement rating dataset, a possible interactive would be to see if these collision “hot spots” created by bad pavement is more or less intense seasonally.
library(sf)## Linking to GEOS 3.9.1, GDAL 3.2.1, PROJ 7.2.1library(tmap)## Registered S3 methods overwritten by 'stars':
## method from
## st_bbox.SpatRaster sf
## st_crs.SpatRaster sflibrary(sp)
#pavement_rating <- read_csv("dataset/pavement.csv") %>% st_as_sf(coords = 'the_geom') %>% filter(Rating_B > 0) %>% sample_n(5000) %>% st_set_crs(2263)
pavement_rating <- st_read(here::here("dataset/dot_V_SSS_SEGMENTRATING_1_20211110.shp"), quiet=TRUE)
pavement_rating <- pavement_rating %>% st_as_sf() %>% filter(Rating_B>0)
collision_use <- read_csv(here::here("dataset/NYC Collision 10000.csv")) %>% filter(!is.na(LONGITUDE)) %>% filter(!is.na(BOROUGH))## Rows: 6118 Columns: 31## -- Column specification --------------------------------------------------------
## Delimiter: ","
## chr (18): MONTH, DAY, CRASH TIME, BOROUGH, LOCATION, ON STREET NAME, CROSS S...
## dbl (13): YEAR, ZIP CODE, LATITUDE, LONGITUDE, NUMBER OF PERSONS INJURED, NU...##
## i Use `spec()` to retrieve the full column specification for this data.
## i Specify the column types or set `show_col_types = FALSE` to quiet this message.collisions_tmap <- collision_use %>% filter(!is.na(LONGITUDE), !is.na(LATITUDE), LATITUDE != 0, LONGITUDE != 0) %>% st_as_sf(coords = c("LONGITUDE", "LATITUDE")) %>% st_set_crs(2263)
ny <- get_acs(geography = "county", variables = "B19013_001", state = "NY", county = c("New York","Bronx", "Kings", "Queens", "Richmond"), geometry = TRUE) %>% st_set_crs(2263) %>% st_as_sf(pavement_rating_csv, sf_column_name = "the_geom")## Getting data from the 2015-2019 5-year ACS## Downloading feature geometry from the Census website. To cache shapefiles for use in future sessions, set `options(tigris_use_cache = TRUE)`.##
|
| | 0%
|
| | 1%
|
|= | 1%
|
|= | 2%
|
|== | 2%
|
|== | 3%
|
|=== | 4%
|
|=== | 5%
|
|==== | 5%
|
|==== | 6%
|
|===== | 7%
|
|===== | 8%
|
|====== | 8%
|
|====== | 9%
|
|======= | 9%
|
|======= | 10%
|
|======= | 11%
|
|======== | 11%
|
|======== | 12%
|
|========= | 12%
|
|========= | 13%
|
|========= | 14%
|
|========== | 14%
|
|========== | 15%
|
|=========== | 15%
|
|=========== | 16%
|
|============ | 16%
|
|============ | 17%
|
|============ | 18%
|
|============= | 18%
|
|============= | 19%
|
|============== | 19%
|
|============== | 20%
|
|=============== | 21%
|
|=============== | 22%
|
|================ | 22%
|
|================ | 23%
|
|================= | 24%
|
|================= | 25%
|
|================== | 25%
|
|================== | 26%
|
|=================== | 27%
|
|=================== | 28%
|
|==================== | 28%
|
|==================== | 29%
|
|===================== | 29%
|
|===================== | 30%
|
|===================== | 31%
|
|====================== | 31%
|
|====================== | 32%
|
|======================= | 32%
|
|======================= | 33%
|
|======================= | 34%
|
|======================== | 34%
|
|======================== | 35%
|
|========================= | 35%
|
|========================= | 36%
|
|========================== | 37%
|
|========================== | 38%
|
|=========================== | 38%
|
|=========================== | 39%
|
|============================ | 39%
|
|============================ | 40%
|
|============================= | 41%
|
|============================= | 42%
|
|============================== | 42%
|
|============================== | 43%
|
|============================== | 44%
|
|=============================== | 44%
|
|=============================== | 45%
|
|================================ | 45%
|
|================================ | 46%
|
|================================= | 47%
|
|================================= | 48%
|
|================================== | 48%
|
|================================== | 49%
|
|=================================== | 49%
|
|=================================== | 50%
|
|=================================== | 51%
|
|==================================== | 51%
|
|==================================== | 52%
|
|===================================== | 52%
|
|===================================== | 53%
|
|====================================== | 54%
|
|====================================== | 55%
|
|======================================= | 55%
|
|======================================= | 56%
|
|======================================== | 56%
|
|======================================== | 57%
|
|======================================== | 58%
|
|========================================= | 58%
|
|========================================= | 59%
|
|========================================== | 59%
|
|========================================== | 60%
|
|========================================== | 61%
|
|=========================================== | 61%
|
|=========================================== | 62%
|
|============================================ | 62%
|
|============================================ | 63%
|
|============================================= | 64%
|
|============================================= | 65%
|
|============================================== | 65%
|
|============================================== | 66%
|
|=============================================== | 67%
|
|=============================================== | 68%
|
|================================================ | 68%
|
|================================================ | 69%
|
|================================================= | 69%
|
|================================================= | 70%
|
|================================================= | 71%
|
|================================================== | 71%
|
|================================================== | 72%
|
|=================================================== | 72%
|
|=================================================== | 73%
|
|==================================================== | 74%
|
|==================================================== | 75%
|
|===================================================== | 75%
|
|===================================================== | 76%
|
|====================================================== | 77%
|
|====================================================== | 78%
|
|======================================================= | 78%
|
|======================================================= | 79%
|
|======================================================== | 79%
|
|======================================================== | 80%
|
|======================================================== | 81%
|
|========================================================= | 81%
|
|========================================================= | 82%
|
|========================================================== | 82%
|
|========================================================== | 83%
|
|=========================================================== | 84%
|
|=========================================================== | 85%
|
|============================================================ | 85%
|
|============================================================ | 86%
|
|============================================================= | 86%
|
|============================================================= | 87%
|
|============================================================= | 88%
|
|============================================================== | 88%
|
|============================================================== | 89%
|
|=============================================================== | 90%
|
|================================================================ | 91%
|
|================================================================ | 92%
|
|================================================================= | 92%
|
|================================================================= | 93%
|
|================================================================== | 94%
|
|================================================================== | 95%
|
|=================================================================== | 95%
|
|=================================================================== | 96%
|
|==================================================================== | 96%
|
|==================================================================== | 97%
|
|==================================================================== | 98%
|
|===================================================================== | 98%
|
|===================================================================== | 99%
|
|======================================================================| 99%
|
|======================================================================| 100%## Warning: st_crs<- : replacing crs does not reproject data; use st_transform for
## thattm_shape(ny)+tm_borders()
#tm_shape(ny)+tm_borders()+ tm_layout(aes.color="#00000000")
pavement_rating_bad <- pavement_rating %>% filter(RatingWord=='POOR')

#tm_shape(pavement_rating)+tm_dots(size=.05, col='Rating_B', palette='-viridis')+tm_shape(pavement_rating_bad)+tm_dots(size=.5, col='yellow')


tm_shape(pavement_rating)+tm_dots(size=.05, col='RatingWord', palette='viridis')+tm_shape(pavement_rating_bad)+tm_dots(size=.1, col='yellow')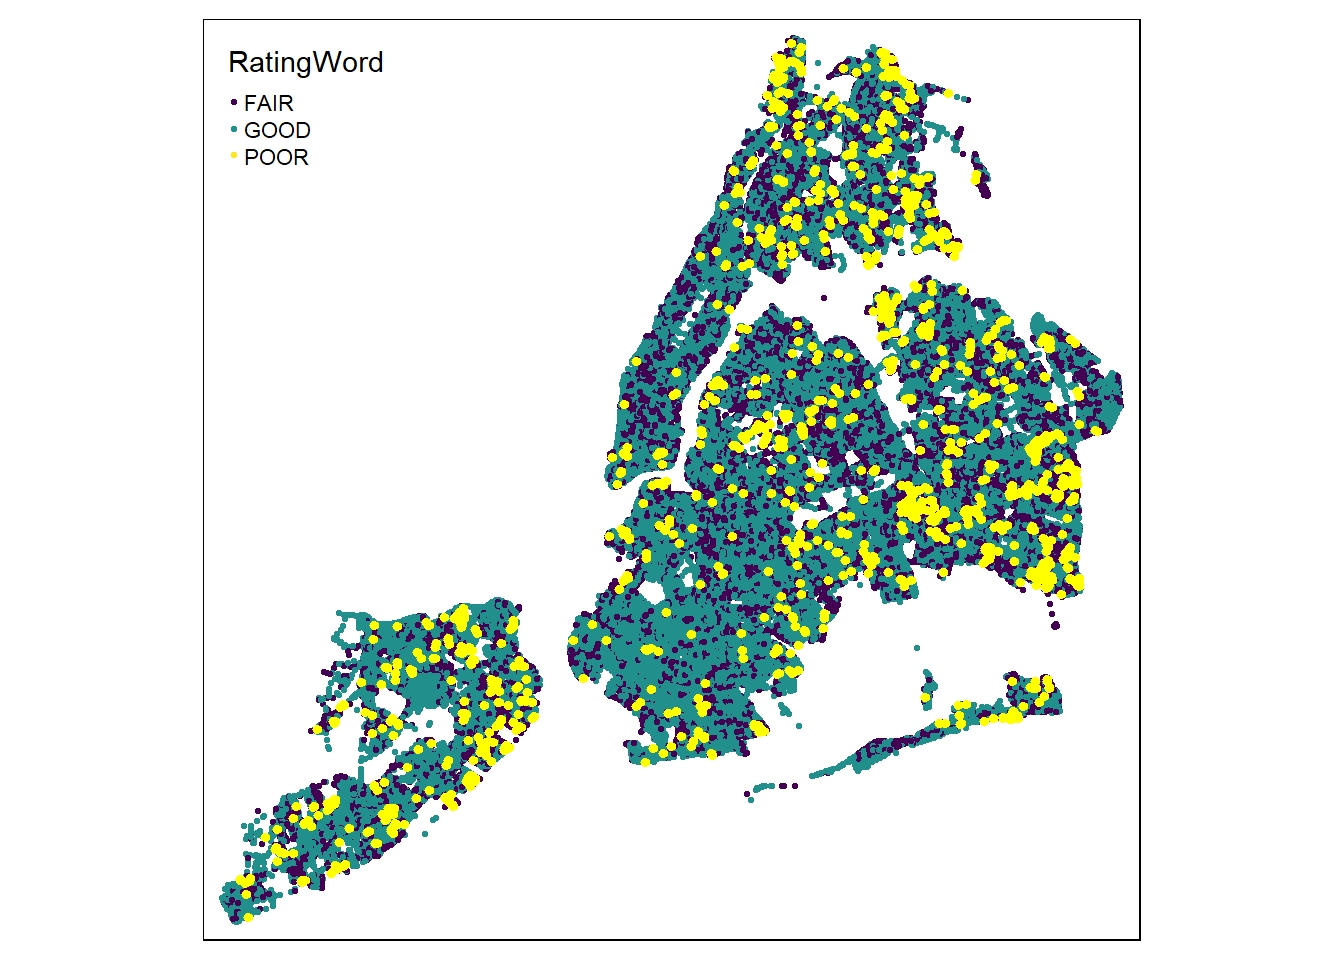
collisions_tmap <- collisions_tmap %>% group_by(`ZIP CODE`) %>% mutate(collision_count=n()) %>% mutate(coll_count_prop = collision_count/3680)

tm_shape(collisions_tmap) + tm_dots(size=.1, col='coll_count_prop', palette='viridis')+tm_layout(aes.color="#00000000")+ tm_shape(pavement_rating_bad)+tm_dots(size=.5)+tm_layout(aes.color="#00000000")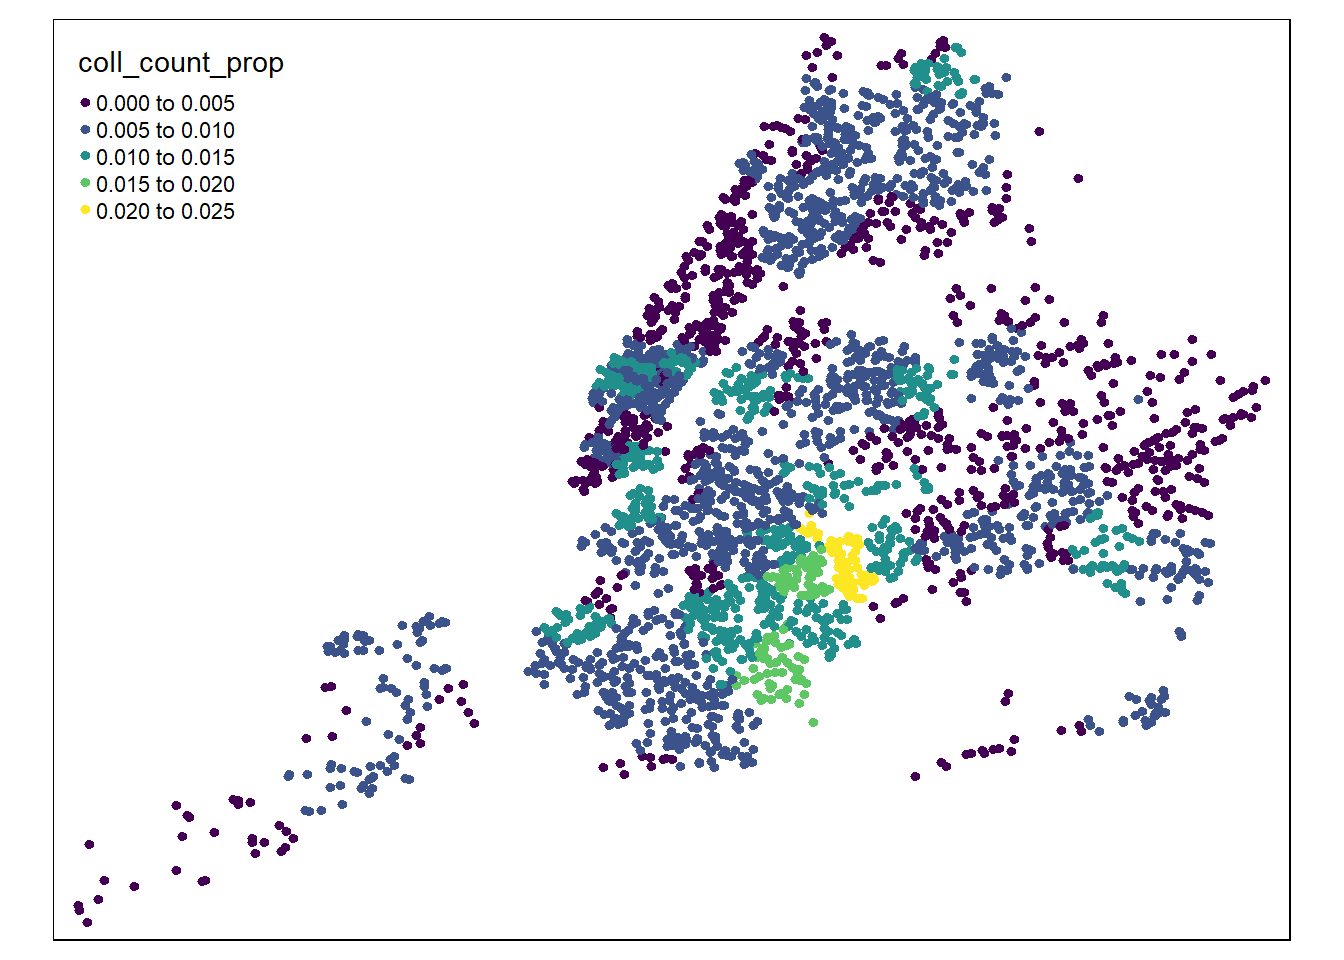
(collisions_tmap %>% distinct(`ZIP CODE`, collision_count, coll_count_prop)) %>% arrange(-coll_count_prop)## # A tibble: 179 x 3
## # Groups: ZIP CODE [179]
## `ZIP CODE` collision_count coll_count_prop
## <dbl> <int> <dbl>
## 1 11207 77 0.0209
## 2 11234 60 0.0163
## 3 11212 60 0.0163
## 4 11101 55 0.0149
## 5 11434 51 0.0139
## 6 11236 50 0.0136
## 7 11385 48 0.0130
## 8 10036 48 0.0130
## 9 10002 48 0.0130
## 10 11203 46 0.0125
## # ... with 169 more rows A primary objective of our project was to explore what factors contribute to accidents, so that we could possibly offer educated recommendations to increase the safety of NYC. The Contributing Factor is really useful for identifying where NYC can improve safety from collisions. Our original dataset included the following variables: CONTRIBUTING.FACTOR.VEHICLE1, CONTRIBUTING.FACTOR.VEHICLE2, CONTRIBUTING.FACTOR.VEHICLE3, CONTRIBUTING.FACTOR.VEHICLE4, CONTRIBUTING.FACTOR.VEHICLE5. Most of the observations in the dataset do not have values for CONTRIBUTING.FACTOR.VEHICLE3, CONTRIBUTING.FACTOR.VEHICLE4, CONTRIBUTING.FACTOR.VEHICLE5, so we created a new binary variable which represents if 3 or more vehicles were involved in an accident, and dropped the aforementioned variables. Also, CONTRIBUTING.FACTOR.VEHICLE1 has much fewer missing values than CONTRIBUTING.FACTOR.VEHICLE2, so we analyze these separately. For both vehicles 1 and vehicles 2, Driver Inattention/Distraction was the number one Contributing Factor to accidents. Following Too closely, and Failure to Yield Right-of-Way were among the top Contributing Factors for both vehicles. For Vehicle 1, the Contributing Factor that led to the most total deaths was Failure to Yield Right-of-Way. For Vehicle 2, the Contributing Factor that led to the most total deaths was Driver Inattention/Distraction. One recommendation for the future is to increase regulations and penalties on phone use while driving because smartphones are the biggest distraction on the planet. Another possible use of the contributing factor variable is to factor in a geographic component, and explore if different areas have different contributing factors for collisions. Different causes may be more prevalent in certain areas/types of roads, giving information for analysis. This is important because in order to reduce collisions, it is imperative to zero in on the exact reason(s) for collisions and target those causes based on where they cluster on the map.